Explanation of the Physiospect Graphs
The NLS (Non-Linear System Diagnostics) device Physiospect analyses the functional state of organs and tissues in order to discover physiological disorders and to define the characteristics of pathology.
Physiospect supports the investigator in characterizing diseases. This characterization is supported by different spectral views. The different views produced by the Physiospect are:
- The Energetic View
displays a set of equidistant dipoles that represent an organ's energy state at individual points of measurement. - The Equilibrium Spectrum
representing the dynamic regulatory characteristics of an organ. Whilst the Energetic View represents a snapshot of an organ at the time point of measurement, the equilibrium spectrum represents long-term disorders in the organism and allows distinguishing acute from chronic processes. - The Entropy Spectrum
to determine the level of expression and the kinetics of a disease. - The NLS Spectrum
utilized exclusively for oncology and helps to characterize the dynamics of carcinoma processes.
Throughout the diagnostic process, it is important for the investigator to include all spectra into the diagnosis in order to interpret the results of the analysis correctly.
This document describes interpretation rules and may support the investigator in deriving diagnostic conclusions.
The Energetic View
Within each analysis, the energetic view is always the initial view that the Physiospect automatically produces after the measurement

Energetic View of a patient's right knee
Each energetic view consists of two layers. The first layer contains a picture of the investigated organ. The second layer is setup of a series of spatially distributed dipoles, representing the individual energy state at each location. Six symbols represent different energy levels
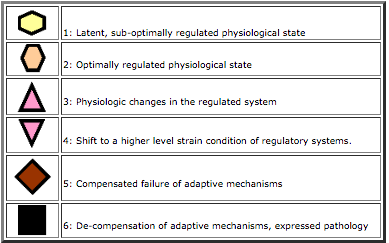
Among all spectral views, the energetic view is the most intuitive and can be easily understood by patient and physician. However, since this view is a dynamic snapshot, an aggregation of state 6 symbols (black squares) might be reversible and thus, care has to be taken into consideration when interpreting this view.
Reversibility of dynamic processes can be explained with the following example:
In a healthy patient the representation of the energetic view of the liver would be expected as a set of state 2 and 3 symbols.
Assume that this patient is consuming 50g of alcohol, followed by re-analysis of the liver. The energetic view would result in an increased number of state 5 and state 6 symbols. This increase is of temporary nature and relaxation of regulatory systems should result in the initial state within one hour after consumption (this number may vary, depending on the alcohol tolerance of the patient).
To avoid false this kind of positive results, it is important to consider the following points when analysing a patient.
Un-biased analysis is obtained best when performing the analysis of a patient in the morning before breakfast.
Nutrition and environmental influences (stress) might have impact on the energetic view.
Consult the patient about food & beverage consumption prior to the analysis.
For analysis of the patients gastro-intestinal tract, a re-analysis might be useful in order to determine the relaxation time. This helps to avoid false positive results.
The NLS theory postulates, that the energy state correlates with the state of disorder in a given tissue/organ. In Physiospect, an aggregation of state 6 energy levels (black squares) represents a strong disorder in the corresponding region. Usually, this indicates an expressed pathology.
On the other hand, there are disorders that are not visible with NLS methods (e.g. cyst, calcaneal spur, etc.). These disorders are anomalies in terms of morphology, but they do not cause changes in the physiological equilibrium. A calcaneal spur is usually very painful for the patient. This pain is caused by a disorder of the surrounding tissue rather than coming from the spur itself.
For a correct interpretation of the measured results, it is important to consider the following points:
The NLS analysis investigates changes in physiological regulation in the organism. Morphological disorders without physiological changes cannot be visualized.
Consult the patient about his/her pain and include additional analysis and views when no obvious disorder is shown in the energetic view.
The Equilibrium Spectrum
The unit of the ordinate axis of the equilibrium spectrum is decibel, representing the amplification of the measured signal (right ordinate). For reasons of readability, the left ordinate axis is divided into a scale of 1 to 6 points.
The abscissa axis of the spectrum represents the frequency (in Hz) to which the organism is exposed. The frequency range is from 1.8-8.2 Hz and corresponds to the theta wave range of the human brain.
Dissociations
In the above figure, the red spectral line corresponds to the input signal and the blue line corresponds to the output signal of a regulated system. In an optimally regulated system, the red and the blue line are equal in terms of shape and location. However, this represents a theoretical mathematical model. In reality the red and the blue line are never overlapping completely. Moreover, spectra as found in the next figure are typical, even for healthy organisms.
 Dissociations in the Equilibrium Spectrum
The difference between the red and the blue line is called dissociation.
If the blue line is higher than the red line, the dissociation is called positive or anabolic. Since the blue line (the output signal) represents the internal adaptation characteristics of the organ, positive dissociations mean that the organ's inner energy reserve is sufficient to adapt to the disorder. In combination with the energetic view, any state 5 and state 6 symbols would have to be interpreted as reversible physiological disorders without pathologic expression.
In negative or catabolic dissociations, the red line is higher than the blue line. The organism's regulatory mechanisms can usually not adapt to the disorder. If state 5 and state 6 symbols are found in the energetic view, this is interpreted as pathologic state.
Acute and Chronic Processes
The equilibrium state allows distinguishing between acute and chronic processes. For this, the 3 horizontal lines, are investigated.
These lines are called the iso -lines.
- The red iso -line represents the mean value of the input signal.
- The blue iso -line represents the mean value of the output signal.
- The yellow iso -line represents the overall mean value of the spectrum.
If the separation between the three iso -lines is small, it usually means that the organism can regenerate and the disorder is of temporary nature.
- Acute process:
yellow iso -line < 2.5 points - Sub-acute process:
yellow iso -line 3-3.5 points
Multiple, small dissociations
Small separation between iso -lines - Chronic process:
yellow iso -line > 3.5 points
Flat spectral lines
Red spectral line always higher than blue
The rules of spectral interpretation are underlined with examples of processes in different states.

Healthy Tissue
Acute Process

Sub-acute Process

Chronic Process

Benign Tumor

Malignant Tumor
Entropy Spectrum
This is a complementary view to the Equilibrium Spectrum to further characterize the state of a disease.
The Entropy Spectrum is analyzed, when the measured signal is very similar to the reference spectrum (absolute reciprocal similarity value < 0.2). In this case, the state of a disease can be characterized by comparison with the reference spectrum.
")
Entropy Spectrum ( Osteoporose )
The entropy spectrum shows a set of 5 states of a disease. The lines in front represent healthy tissue without pathological expression. The lines in the back represent a chronic pathology.
The thick red and blue lines represent the measured input and output signal. The more the measured lines are in the back of the spectrum, the higher is the pathology expressed.
NLS Spectrum
Multidimensional NLS-analysis is identical to entropy analysis except that in NLS-analysis, all intermediate stages are recorded as physiological states from patients in different stages of the developing process under investigation. This enables building a more accurate model of the pathology development. NLS analysis is used solely to evaluate malignant processes and biochemical factors.
Analysis of oncology processes by an NLS analysis makes it possible to trace the possibility of an irreversible state in the pathology development. Growing amplitude of the output signal (the blue line in the graph) indicates increase of the compensatory mechanisms. On reaching the maximum value, the input signal graph may drop abruptly with high amplitude values of the input signal (red line) which indicates a failure in adaptation mechanisms and development of irreversible states.